DATA SOURCES
Pingdom
Enhance your website monitoring processes and prevent downtime with a Pingdom dashboard from AppInsights.

Pingdom makes it easy to manage every element of your website or web application. With the Pingdom integration for AppInsights, users can extract data from their Pingdom account for use in building custom KPI dashboards that visualize critical web performance stats in real-time. Our browser-based dashboards can be accessed from anywhere, across all devices, and will keep Pingdom metrics in the hands of those stakeholders that need it most.
What can I accomplish with a Pingdom dashboard?
- Investigate how site performance is functioning over all, or investigate the experience of individual users so problem areas never remain hidden
- Gain critical insight on your website performance, enabling you to act quickly when trouble arises or before it ever occurs
- Create unique dashboards for specific elements of your web experience so new pages or modules can be closely tracked until they stabilize
- Mix and match visualizations from an assortment of other relevant third-party services -- from analytics (Google Analytics, Mixpanel) to help desk (Zendesk, UserVoice) -- so you can track the real-time impact of web performance on user experiences

METRICS
- Actions
- Average Response Time
- Summary Outage
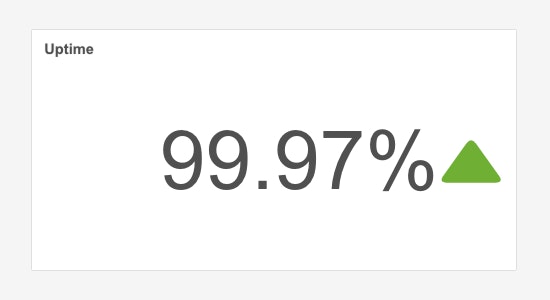
- Uptime / Downtime
- Number of Downtimes
- and more...

Find out how easy it is to gather and understand your most important metrics when you sign up for a free AppInsights trial.